
Business Intelligence has become an essential part of the airlines success to monitor the progress and action in time.
It’s the final stretch of the process that determines whether Business Intelligence makes an impact – or not.
After all, if people don’t read reports, understand them, and take appropriate actions, all the time and effort spent collecting, saving, and preparing data was for nothing. The conditions for human perception are complex, but not as individual as you might think. We have focused on these common traits and used them to design information systems.
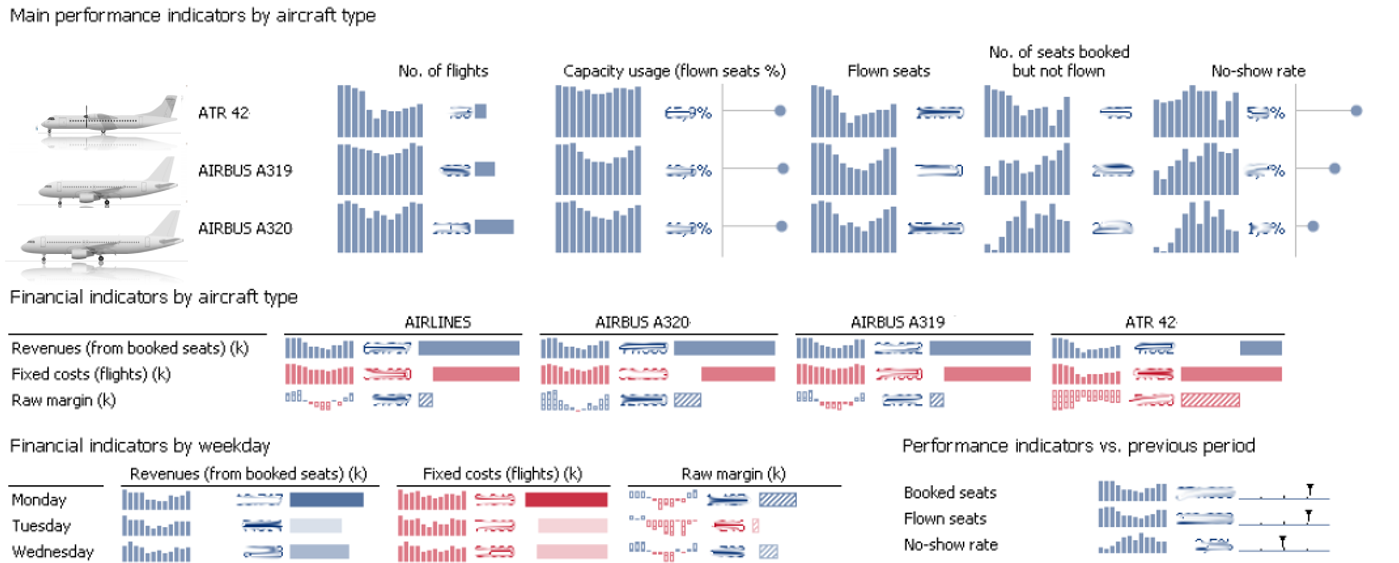
Our framework is based on a Data Analytics tool (e.g. Bissantz DeltaMaster) and a pre-configured Travel industry ruleset, so implementation time is a question of hours and not weeks. DeltaMaster triggers signals based on universal standards for reports and analyses. These signals communicate variances and management information faster and clearer than ever before.
When starting, turning around or managing companies it is key to have a quick glance into the
- actual (realtime) status
- drivers and compensators behind “numbers”
- trend and pattern analysis of specific areas, and the
- possibility to “pin” specific areas of interest and to keep them on your watchlist
Get a first insight here:
Sample story with an airline background:
A “startup” screen on the PC / Web / Mobile is a free configurable tile page that indicates your status, trends and health (e.g. airline):
Do you see the red Revenue trend (-73 K)?
Clicking on that tile the system will immediately bring you to an overview context of that trend:
You see that this trend has been mainly caused by Flights from CPH !
To act you want to go even a step further and the systems offers you a function “Show me the reason for that!”, so that you can directly force actions:
Focusing on the CPHOSL route ...
The reason for the negative (-21K) revenue trend at CPHOSL:
Behind-21k on CPHOSL is more truth. You see drivers for the loss, but also compensators
This allows you fine tuning your actions!
We also offer a “Tree style” view on the drivers and compensators:

(Color indicates the relevance of influence)
With a framework like that we are able to:
- Connect fast to existing data sources and connect them with the travel domain context
- Gain fast insight into the business
- Identify true drivers and compensators (also in combinations)
- Agree on specific action
- Monitor the action over the time (you may also pin that area as a tile on your startup page)
Additionally here some more general features of the Bissantz DeltaMaster we provide:
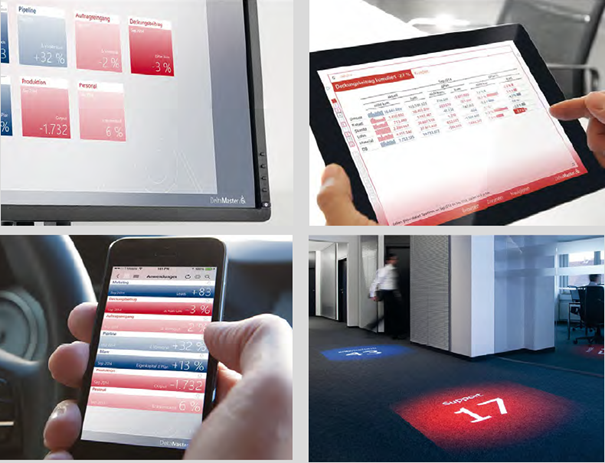
Mobile devices, kiosk systems, business control centers
The reports look just as impressive on the smaller displays of smartphones and tablets as on the big screens of laptops, desktops, kiosk systems, and business control centers. You can store data and applications centrally in the cloud and use them both online or offline – including in places where little to no interaction is desired or possible.
Navigation and analysis methods
You can answer the most important questions for your business directly within a report using three powerful, yet easy-to-use methods: Browse, Zoom, and Navigate. These methods show the causes for variances and changes or how different KPIs have developed over a certain period.
The Browse method displays the analysis model in a graphical tree structure. If you mouse over a node, it will apply that member as an additional filter to the report (in what we call an analytic preview) and modify the report automatically. This allows you to quickly gain insights on various aspects of the report. You can also apply color-coding options to the tree to show the breakdown of a given measure. This is very useful when examining variances with potential compensating effects.
The Zoom method enlarges the sparklines in pivot tables. Unlike standard zoom functions, the system utilizes the growing amount of empty screen space to display additional information as well. In other words, the informational content of the report grows with each zoom level, so you can examine and compare the KPI’s development in detail.
The Navigate method expands the pivot table, step by step, with additional columns or rows based on the context. Each step then shows how the given value breaks down into the members of a further dimension. These steps can be defined in advance, selected individually, or performed automatically based on a data mining algorithm.
Forecasts
With a single click, you can create forecasts and projections for all actuals. Choose from simple, robust methods such as exponential smoothing and linear regression, values calculated from external modules, or a custom method developed by our forecasting experts. You can also create custom forecast models with the help of simple dialog boxes and powerful MDX queries.
Self service
We support spontaneous self-service analysis - even on new pools of data. Once you have imported your Excel, Access, or other relational sources, you can get right to work.
Mobile devices, kiosk systems, business control centers
Various frontends (also mobile support) are available to bring relevant data in near time to the decision makers.
We are working with …
- data sources from Amadeus, Sabre, Airpas, Worldticket, Maureva, MonaLisa, SKYfly Revenue, iPort, Bravo
- analytical tools like Bissantz DeltaMaster, Tableau, Oracle BI, Arcplan and also Excel
- platforms like Microsoft SQL Server and Analysis Service, Oracle, MySQL, MongoDB, noSQL, Big Data